Powerful Insights Through Advanced Reports
Make data-driven decisions with powerful analytics and comprehensive reporting tools designed for modern contact centers.
Comprehensive Report Types
Get the insights you need with our extensive range of report types
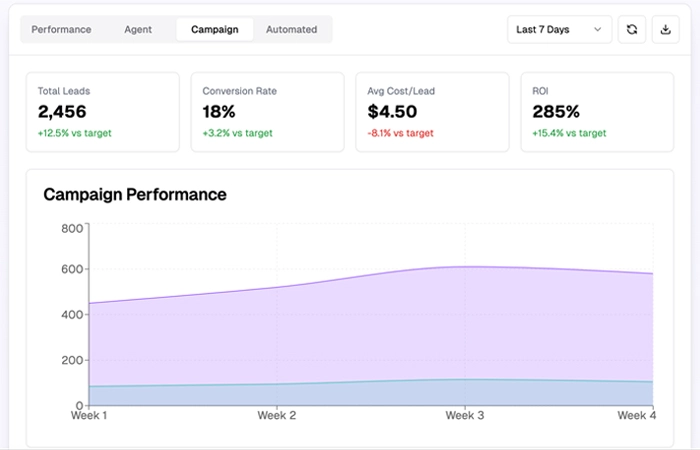
Campaign Reports
Track and optimize your marketing campaign performance.
- Lead generation
- Conversion rates
- Campaign ROI
- Source tracking
Agent Reports
Monitor individual and team performance metrics.
- Agent productivity
- Quality scores
- Schedule adherence
- Skills assessment
Performance Reports
Track key metrics and KPIs for your contact center operations.
- Resolution rates
- Call volume analytics
- Handle time metrics
- Queue performance
Automated Reports
Set up automated report generation and distribution.
- Scheduled delivery
- Multiple formats
- Email distribution
Analytics for Optimal Performance
At DialedIn, we understand that data-driven decision-making is key to the success of any business. That’s why we offer an extensive range of reports designed to provide you with the insights you need to optimize your operations, enhance agent performance, and maximize customer satisfaction.
Actionable Insights for Better Decision-Making
With DialedIn’s powerful reporting tools, you’re not just collecting data—you’re gaining insights that drive action. Our reports are designed to be easy to interpret, with visualizations and summaries that highlight key trends and patterns. This means you can quickly spot opportunities for improvement, address challenges, and stay ahead of the competition.
Advanced Features for Deep Insights
Powerful tools to help you understand and optimize your contact center operations.
Advanced Filtering
Improve resolution rates by connecting customers with the most qualified agents.
Export & Share
Export reports in multiple formats and share with stakeholders.
Visual Analytics
Interactive charts and graphs for better data visualization.
Trend Analysis
Track patterns and predict future performance.
Empower Your Team with Data
We believe that everyone on your team should have access to the data they need to succeed. Our user-friendly interface makes it easy for managers, team leaders, and agents to access the reports that are relevant to their roles. This transparency fosters a data-driven culture where every team member is empowered to contribute to your business’s success.
Ready to Transform Your Analytics?
Join the thousands that enjoy using DialedIn's reporting tools